HOME
THE PIRATE CINEMA
HTML
THE CREATIVE CODING START
CSS&HTML
ARE WE ALL ADDICTS NOW?
PURE DATA
READINGS
P5 BASICS &
READING REFLECTION W9
P5.js & ANIMATED THROBBER+READING W10
SKETCH (FEEDBACK AND LOOP) + READING W11
W12 SIMPLE PROGRAMME &'LOOP' M.FULLER.
CODE & GENERATIVITY
"The Aesthetics of Generative Code"
CODE & OBJECTS
"Randomness"
CODE & ALGORITHMS
with p5.js
CODE & DATAFICATION
+reading
NODE.JS/APIs & Obfuscation, Weird Languages, and Code Aesthetics
JPEG GLITCHES WITH ANTONIO ROBERTS
NODE. JS/APIs & Wendy Hui Kyong Chun. "The Enduring Ephemeral, or the Future Is a Memory."
INITIAL SKETCH (final project)
+ Big Data Aesthetics
SOME CHANGES in(final project)
BIG DATA ART
DEVELOPING THE INITIAL IDEA.
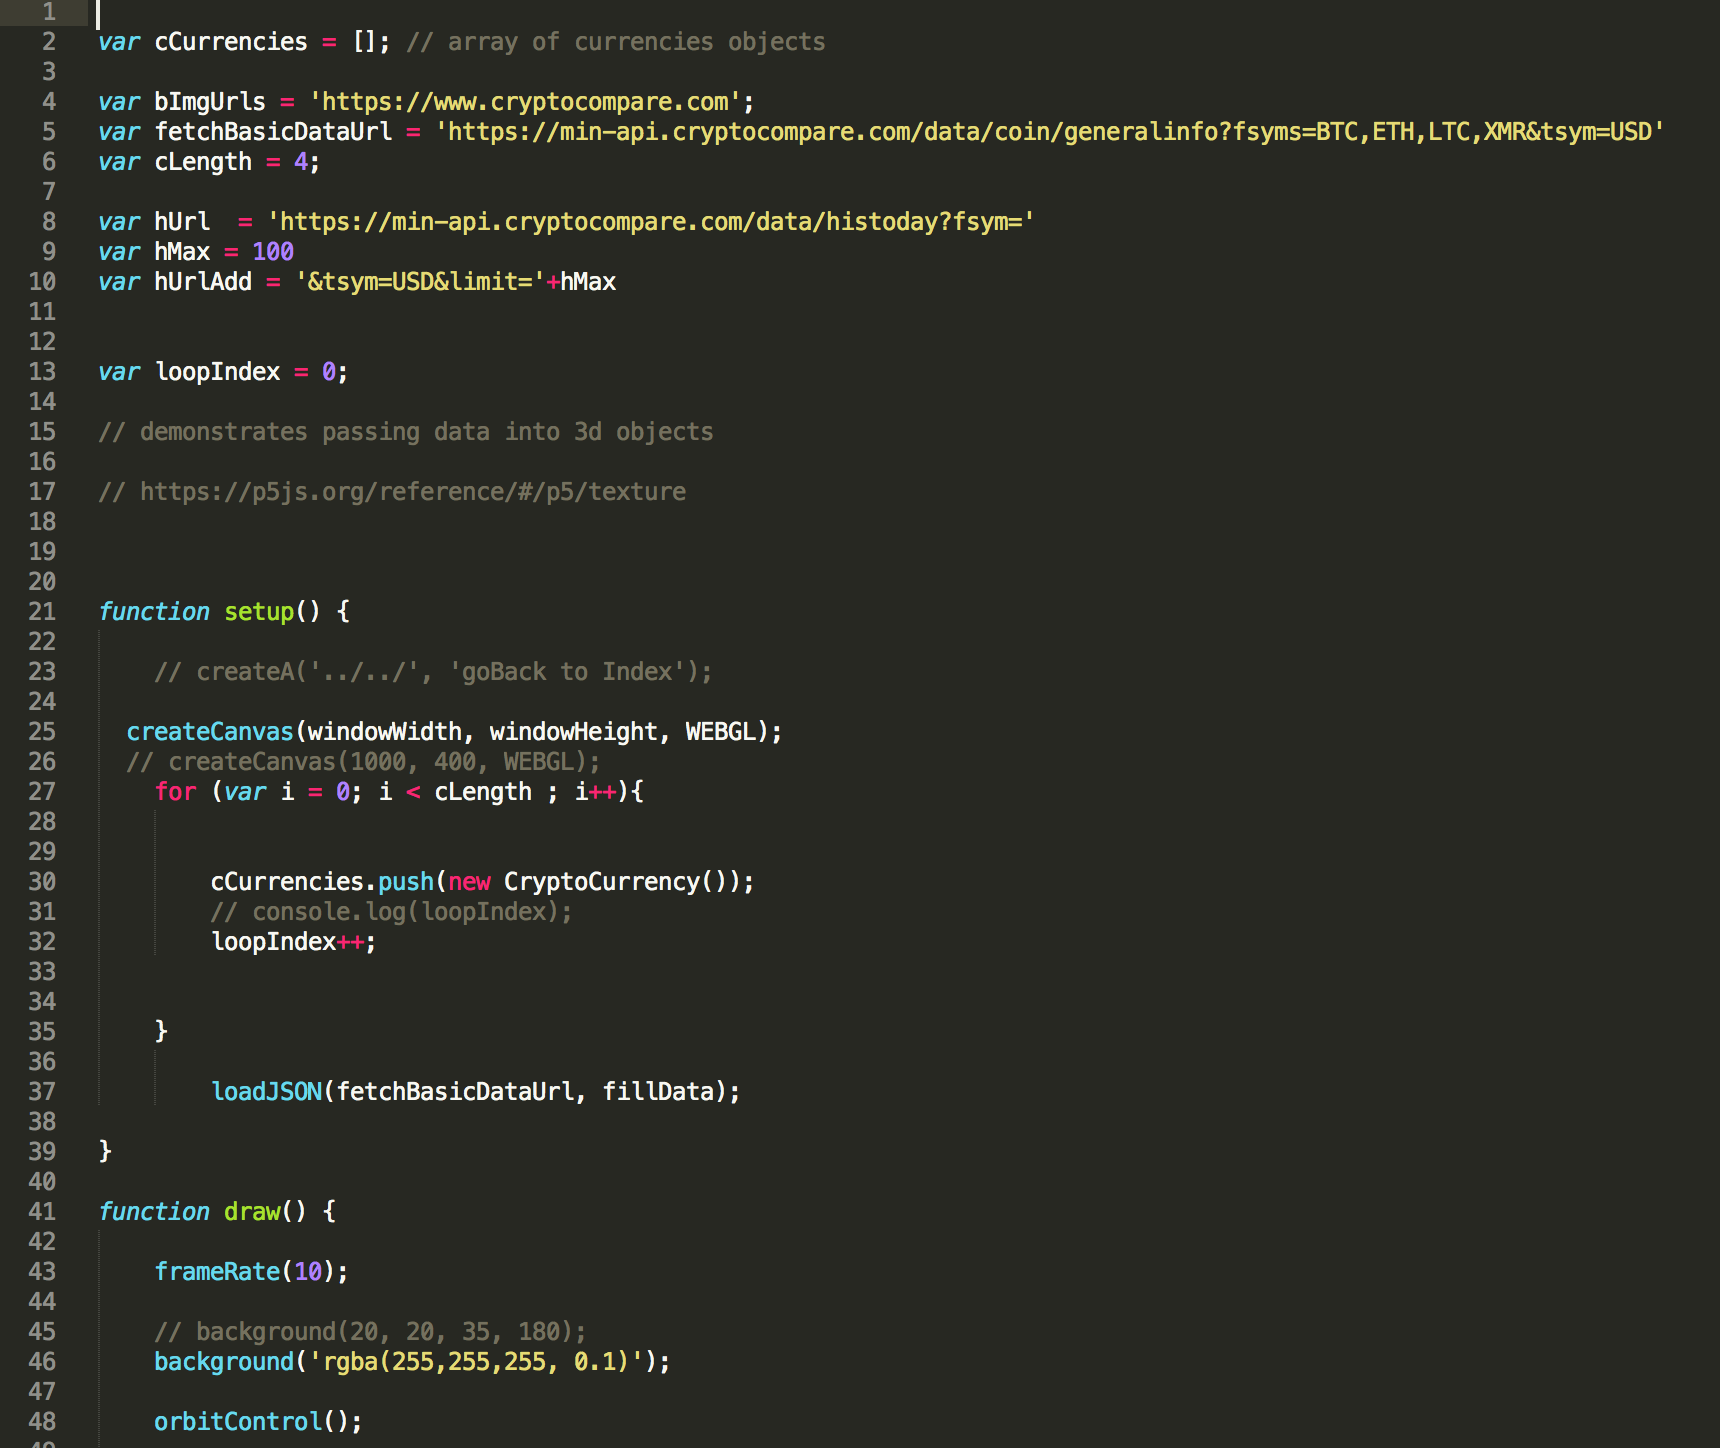
If we work with Cryptocurrency:
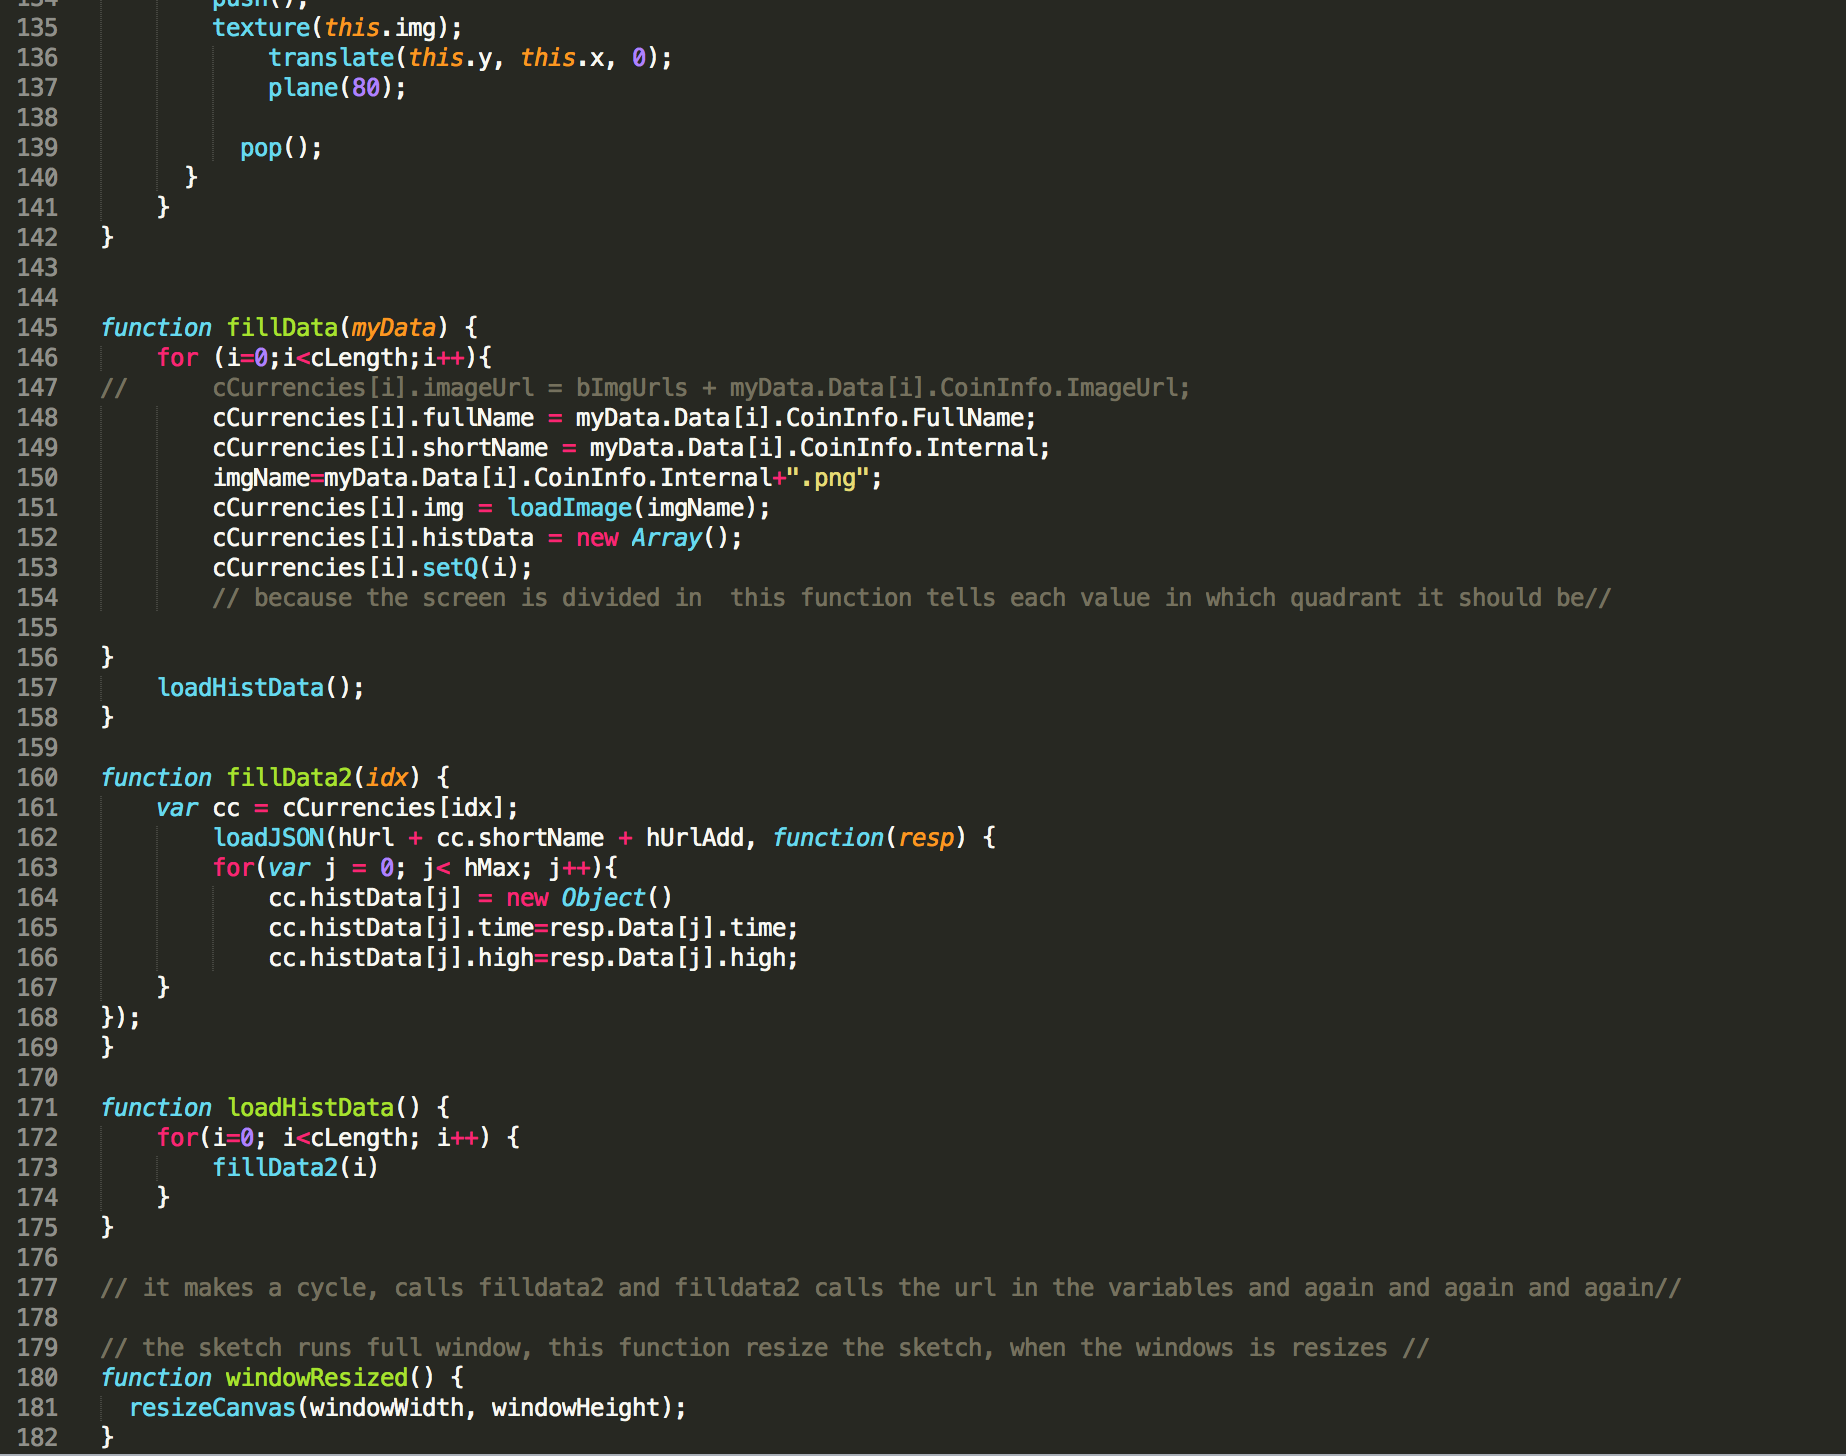
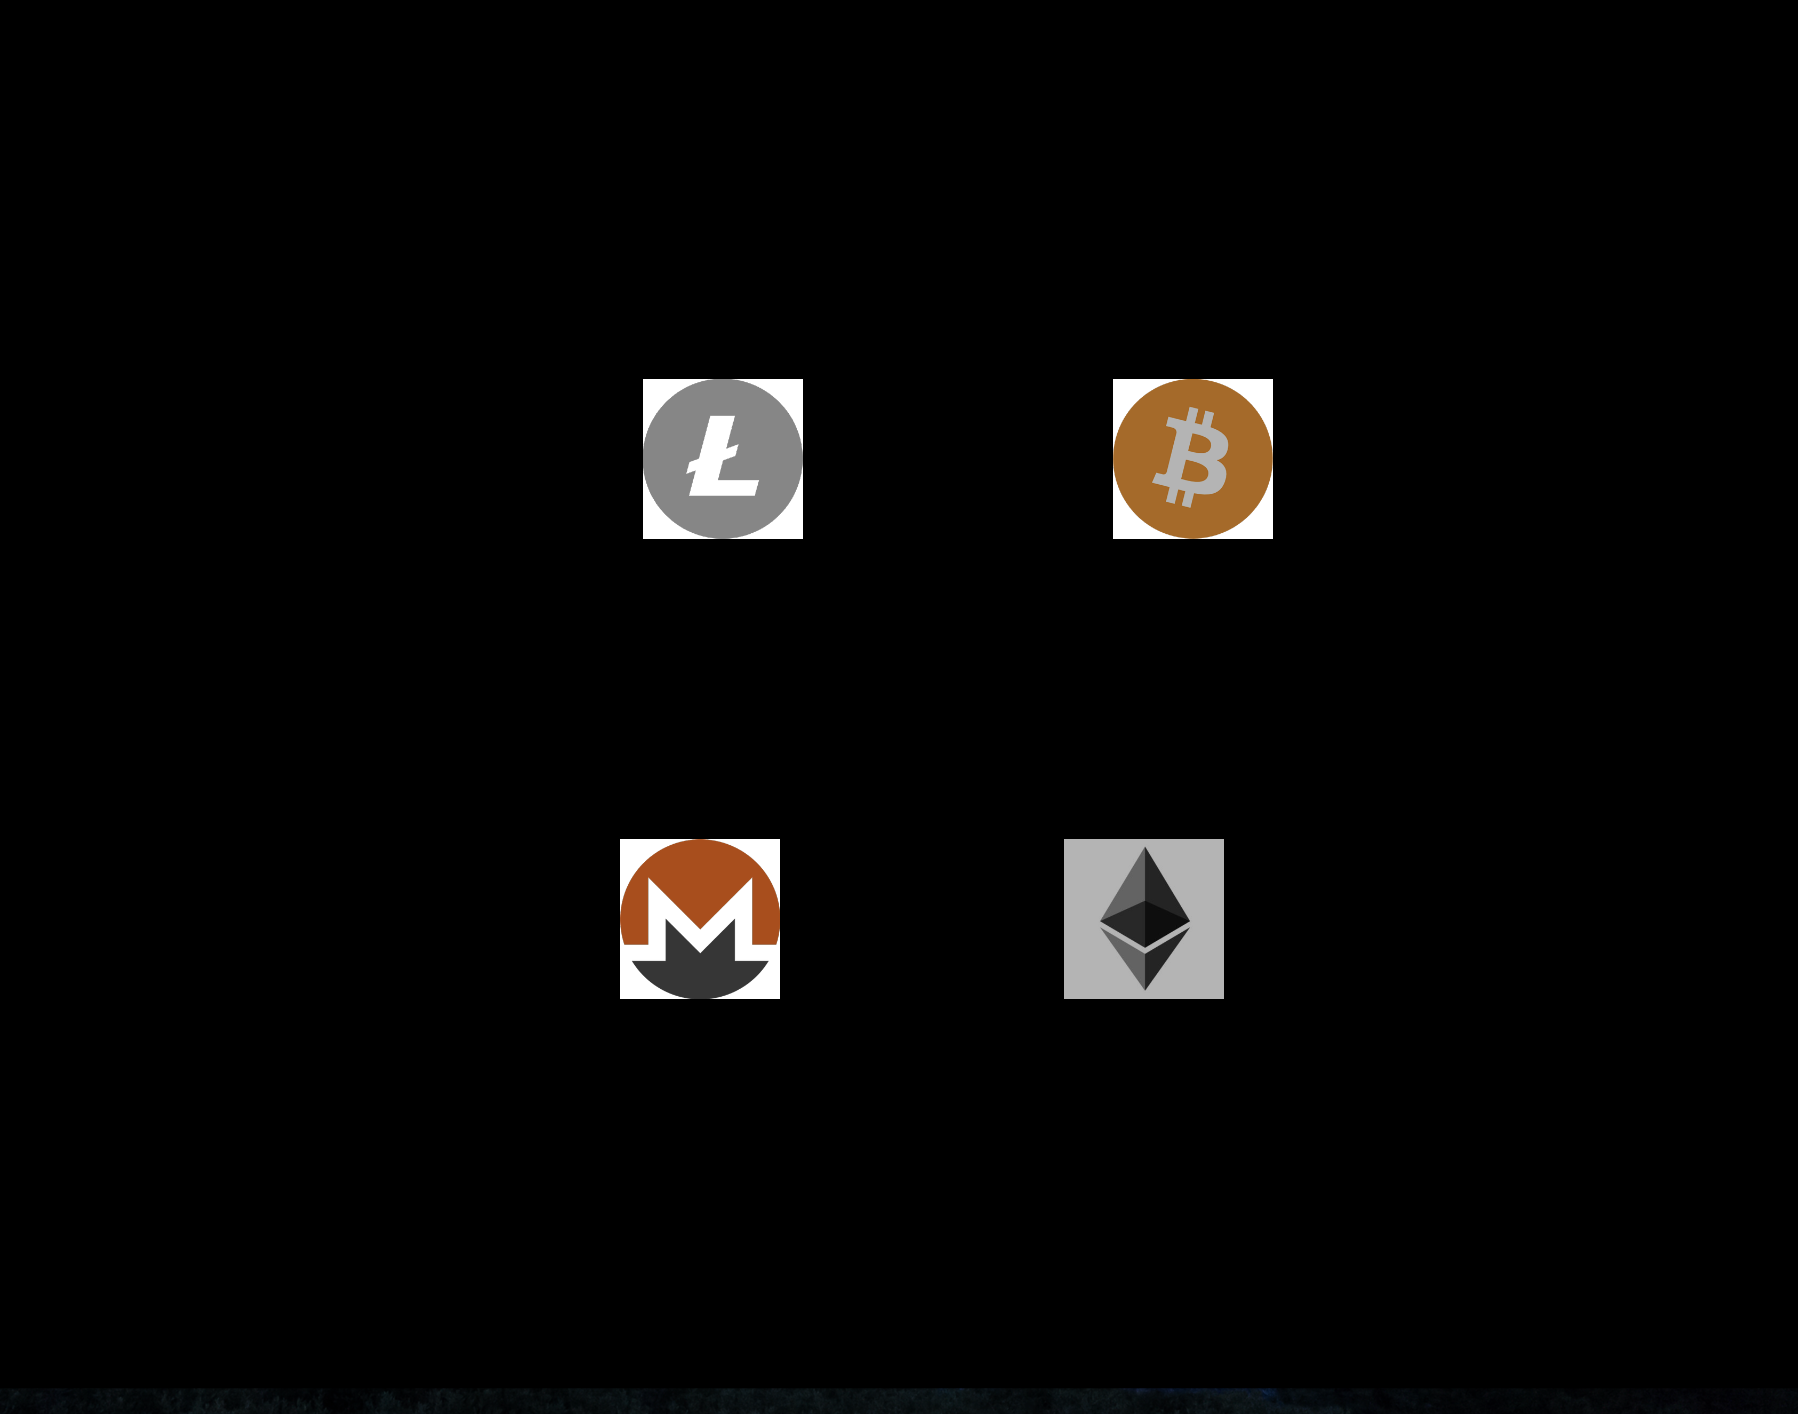
-we are looking at how people are avoiding keeping their money in a bank. We want to portray it through generative art. The art will take data from Cryptocurrency Market Capitalizations API. More specifically it will look at 3 cryptocurrencies: Bitcoin, Ethereum, Litecoin and Moner. Their name,available supply,total supply,percent change in last 24 hours and when it was last updated. All of this information is going to be presented as circles in different colors corresponding to the cion color and also lines in the same color coordination. They will travel in the same direction,disappearing into a “black hole”. Meaning they will all be moving into the middle of the screen meeting there. This will highlight the fact that these currencies are untrackable and that this is one main reason that people use them for.
Bitcoinname: orange circle
-available supply:orange line
-total supply:white line
-percent change in 2h-yellow line
-last update:another orange shade
Ethereumname: light purple circle
-available supply: light purple line
-total supply:dark purple line
-percent change 24h: light pink line
-last update:dark pink line
Litecoin: light grey circle
-available supply:light grey line
-total supply: dark grey line
-percent change 24h: brownish grey line
-last update: black
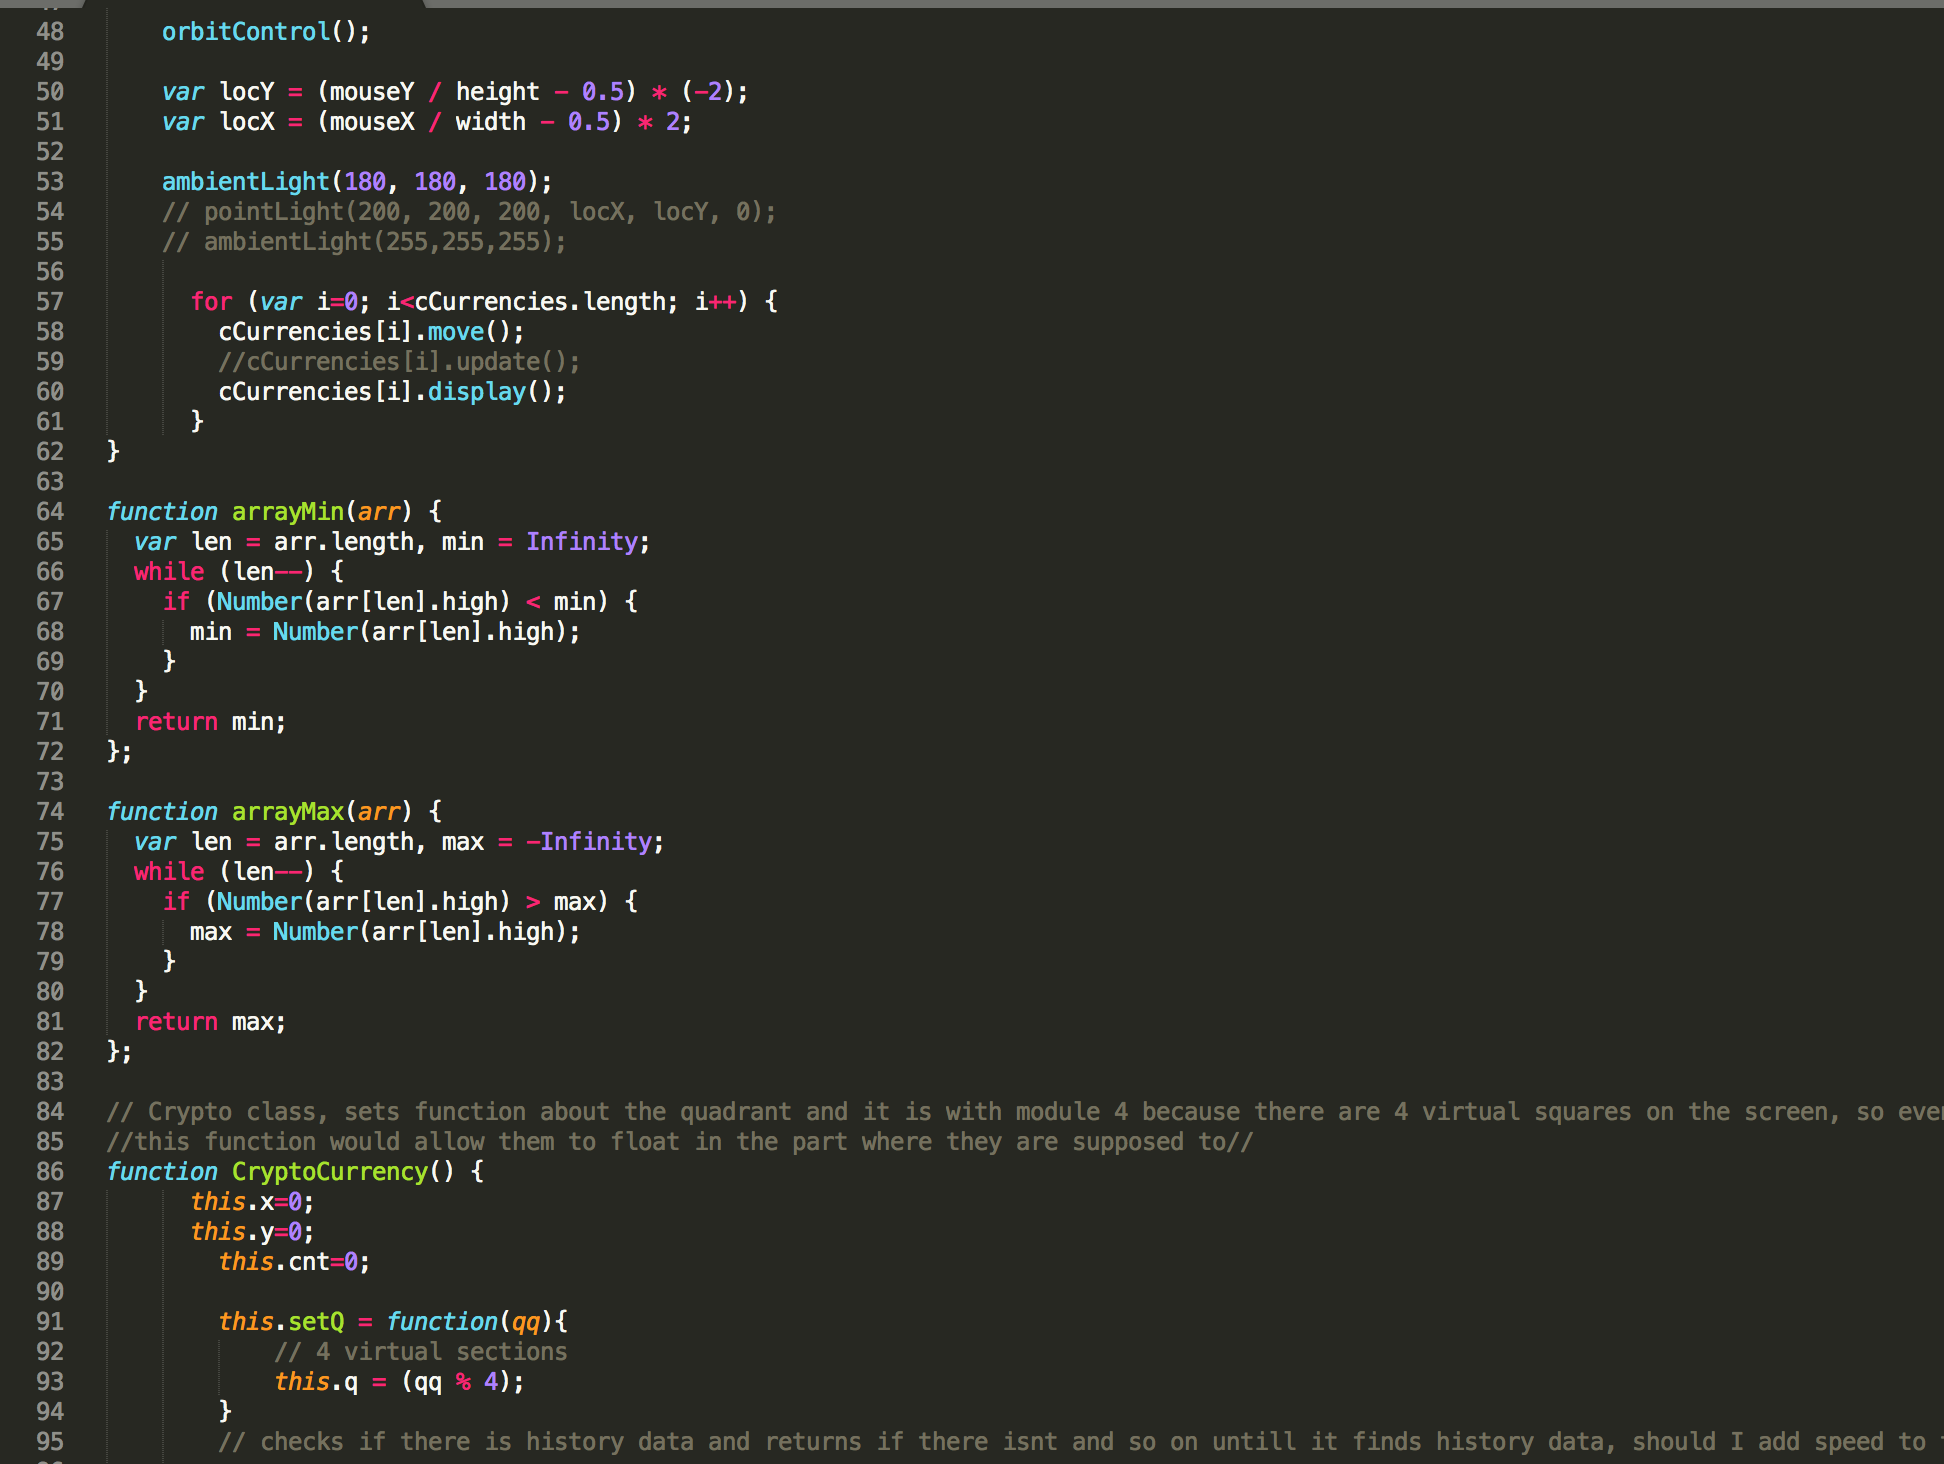
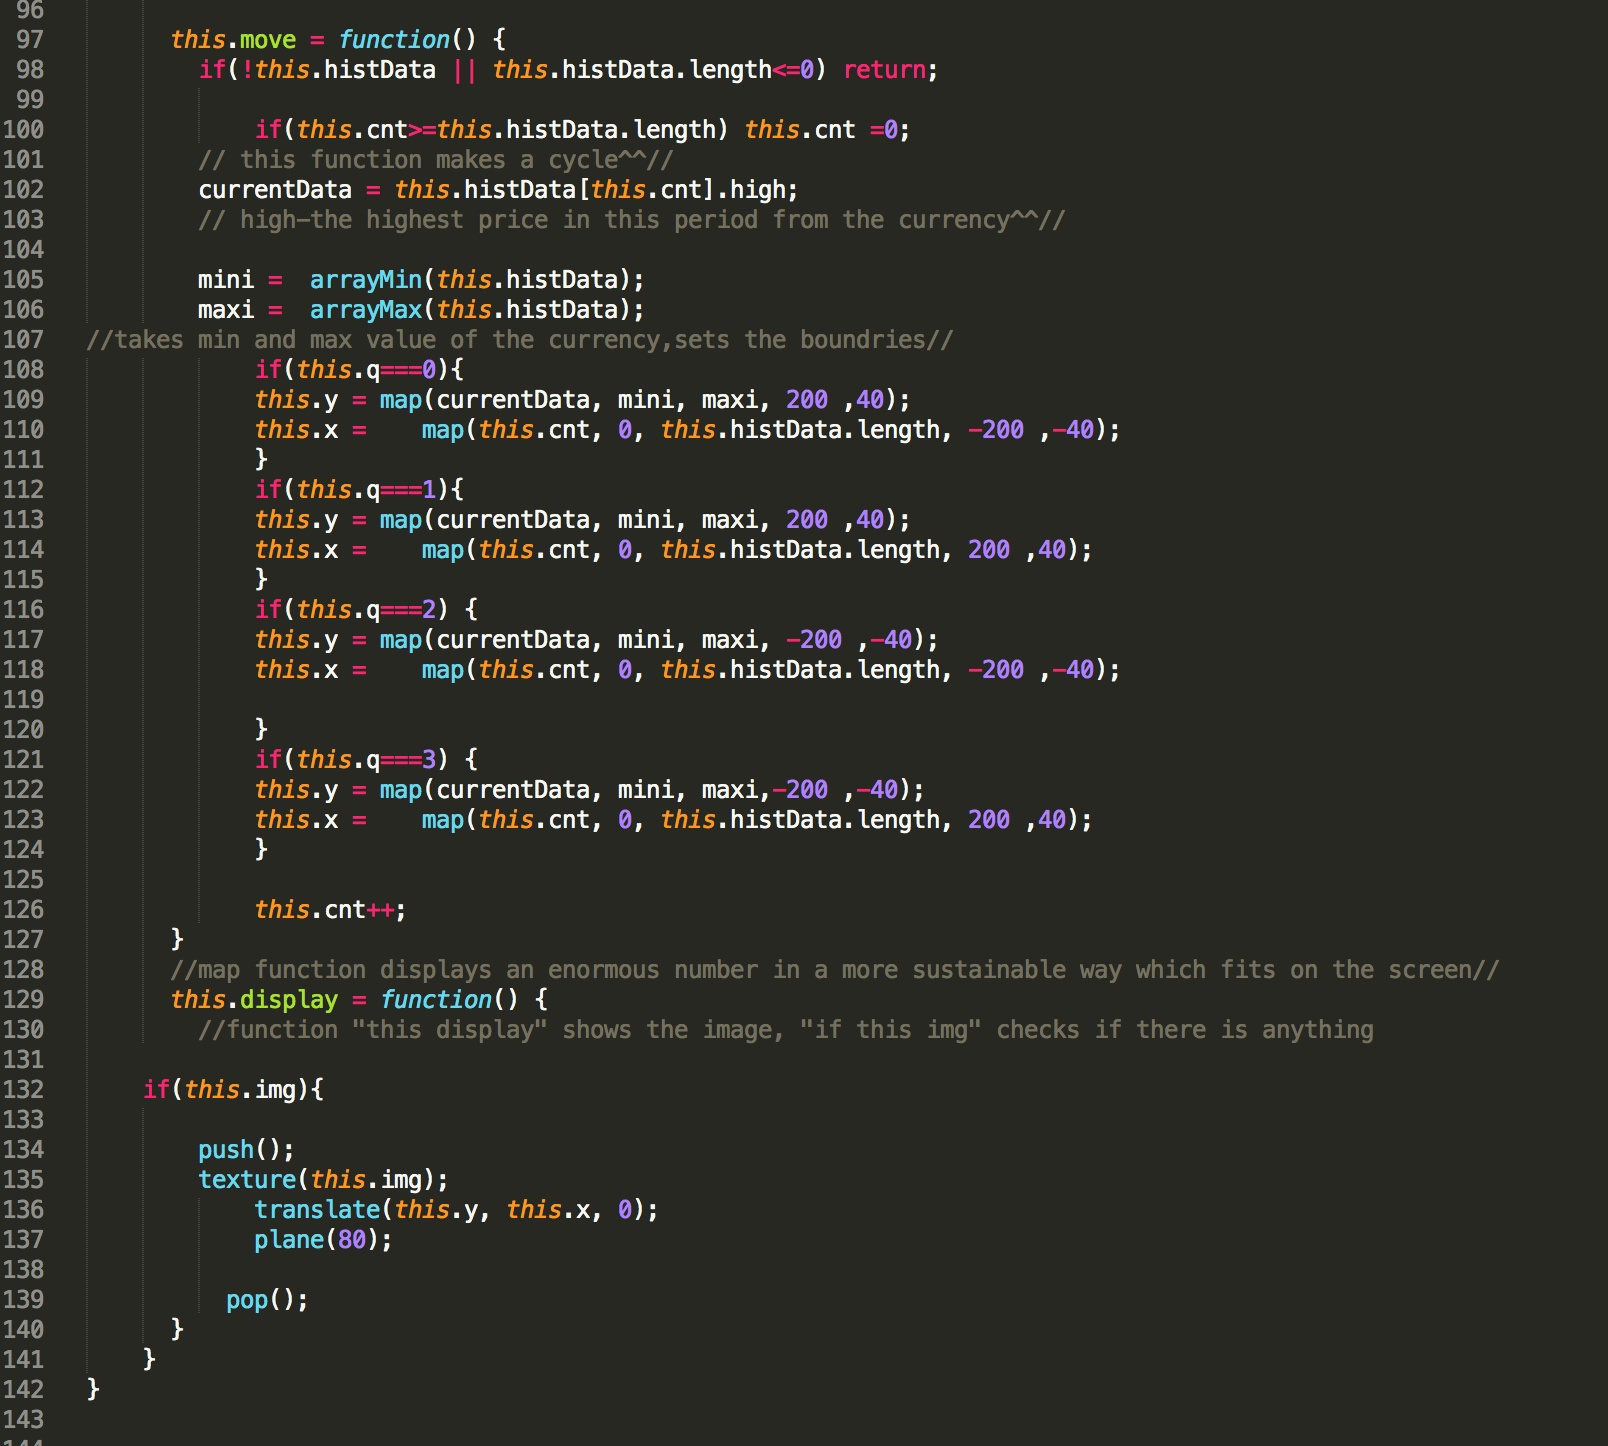
All of the above was an initial and when starting to develop it as seen on the left there were many complication and the whole process of creating of such visuals was just way too complicated and well under the abilities of myself and my team. So what we got so far was the icons on a black screen which had to be virtually divided into sections so that each icon had their own space in their x and y coordinates and can move directly into the centre.
As much as the concept of this idea was aesthetically pleasing, what I have so far (img. in left corner) is not a big success. it is quite dull and uninteresting and does not resemble the initial idea. The good news is that the code is working and we can take it further from her. However we would have to stray in other direction and maybe create some resembling a graph and include more cryptocurrencies so that the canvas is not so empty and unsatisfying. More to come on "SOME CHANGES in (final project)"
INITIAL SKETCHES FOR FINAL PROJECT
FINAL "ADDICTION TO DATA" PROJECT
& some aesthetics explained
BRAINSTORMING FOR FINAL PROJECT